
Why it matters
Understanding how your business performs is essential to making informed decisions and achieving sustainable growth. Business performance and KPI analysis turn financial and operational data into meaningful insights, helping you measure progress, identify inefficiencies and recognise potential issues early.
By tracking the indicators that matter most to your goals—such as profitability, cash flow, costs and productivity—you can see what is working and where action is needed. With a clear view of performance, you can set realistic targets, allocate resources effectively and make timely decisions that strengthen your business.
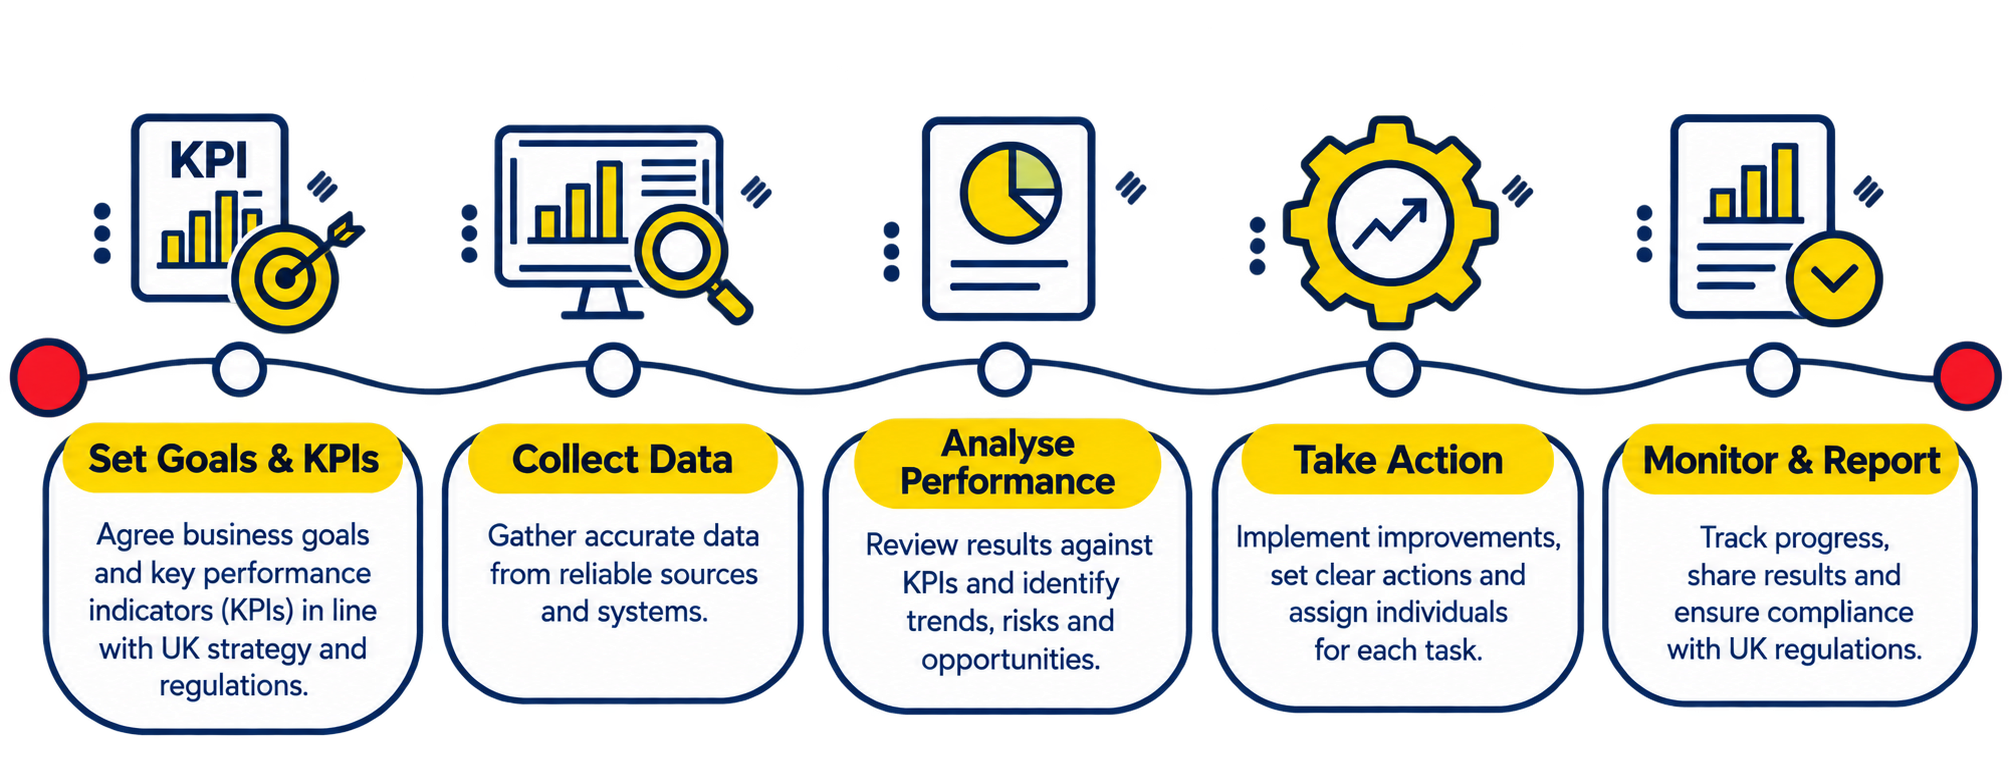
Data-driven decisions
Base choices on evidence from real business data rather than guesswork.
Stronger profitability
Track margin, cost and revenue KPIs to protect and grow the bottom line.
Real-time visibility
Executive dashboards provide live insight instead of delayed reports.
Operational efficiency
Pinpoint bottlenecks and streamline workflows across departments.
Financial control
Monitor cash flow, working capital and financial ratios with precision.
Clear accountability
Defined KPIs create ownership and measurable performance.
Our services
We build tailored KPI frameworks, performance dashboards and management reports covering financial, operational, sales and workforce performance, identifying trends, gaps, risks and opportunities so you can act early.
| Service | Focus |
|---|---|
| Business performance analysis | Financial and operational health, benchmarked against industry standards |
| KPI development and monitoring | SMART KPI frameworks aligned to strategic objectives |
| KPI dashboard reporting | Interactive, mobile and Power BI dashboards |
| Financial KPI analysis | Margins, EBITDA, cash flow, working capital and ROI |
| Budget vs actual performance | Variance analysis and corrective action plans |
| Strategic performance reviews | Quarterly and annual reviews, risk assessment and action planning |
KPIs we measure
| Category | Example KPIs |
|---|---|
| Financial | Revenue growth, gross and net margin, EBITDA, ROI, ROE, working capital |
| Sales | Conversion rate, customer acquisition cost, lifetime value, win rate |
| Operational | Productivity, cycle time, capacity utilisation, inventory turnover |
| Customer | CSAT, NPS, retention, churn rate, complaint resolution time |
| HR | Employee productivity, turnover, attendance, training effectiveness |
We also create custom frameworks, including industry-specific metrics, departmental scorecards, executive KPI sets, project milestone KPIs and ESG and compliance KPIs.
Frequently Asked Questions
Let’s Discuss Your Requirements
Have a question about our services? Speak with our team to discuss your engagement, deadlines and the support you need.
What Is KPI Analysis?
Measuring, tracking and interpreting key performance indicators to show how well a business is meeting its strategic and operational objectives.
Why Is Business Performance Analysis Important?
It gives leadership visibility into financial health, operational efficiency and strategic progress, supporting faster decisions that improve profitability and reduce risk.
How Often Should KPIs be Reviewed?
KPIs should be reviewed on a regular schedule that matches how quickly each measure changes and how quickly you can act on it. As a general rule, operational KPIs are checked weekly, financial KPIs monthly, and the KPI set itself is reassessed quarterly and refreshed once a year.
Can you Build Custom KPI Dashboards?
Yes. We provide dashboards, KPI reporting, performance monitoring and forecasting, tailored to the measures that matter to your business. Whether you need an executive overview or detailed reports for different teams, we can set up clear, up-to-date reporting that shows how your business is performing.
Can Startups Benefit From KPI Reporting?
Yes. Startups often have limited time, budget and people, so knowing which numbers matter is especially valuable. KPI reporting gives founders clear visibility of performance, helps them control costs and supports better decisions about where to invest. It also shows early which areas are working and which need attention. As the business grows, the reporting can scale with it, from a few key measures to more detailed dashboards and forecasting.
How Long Does It Take to Develop a KPI Framework?
Timing depends on your goals, the number of measures and your data. A focused framework can be ready in a few weeks, and we’ll confirm a timeline after an initial discussion.
What Is the Difference Between a KPI and a Business Metric?
A metric is any number you can measure, such as website visits or invoices sent. A KPI is a metric tied directly to a strategic goal, so it tells you whether you are on track. We help you focus on the few KPIs that actually drive your objectives, rather than tracking everything.
Which KPIs do you Measure for Businesses?
We cover financial, sales, operational, customer and HR KPIs. Examples include revenue growth, gross and net margin, EBITDA, customer acquisition cost, NPS, churn rate and employee turnover. We then select the ones that match your goals.